


Hypermeteo
Originated by requests coming mainly from the insurance sector, today Hypermeteo has become an important tool in many contexts:
Smart Agriculture
Risk Assessment & Insurance Analytics
Smart City e Urban Mobility
Predictive Analytics
THE REPRESENTATION OF WEATHER DATA
“In the simplest terms, if the data can answer the question, it is representative”
(Ramsey and Hewitt, 2005)
Representativeness of meteorological data is widely considered by various actors on the international scene: from the WMO, the reference organisation, to a widespread scientific community, to technical, operational and regulatory bodies and institutions, to the world of economics and environment, to community based organisations.
For these organisations the definition of representativeness is tailored according to various considerations of technical-scientific or legal-administrative nature, albeit always in relation to the purpose and methods of use of the data.
The conventional surface value that acts as a minimum pixel of representativeness is therefore not immediately identified but it is the result of a complex process that on the one hand synthetises supporting technologies and on the other hand pragmatically considers the specific needs of the function.
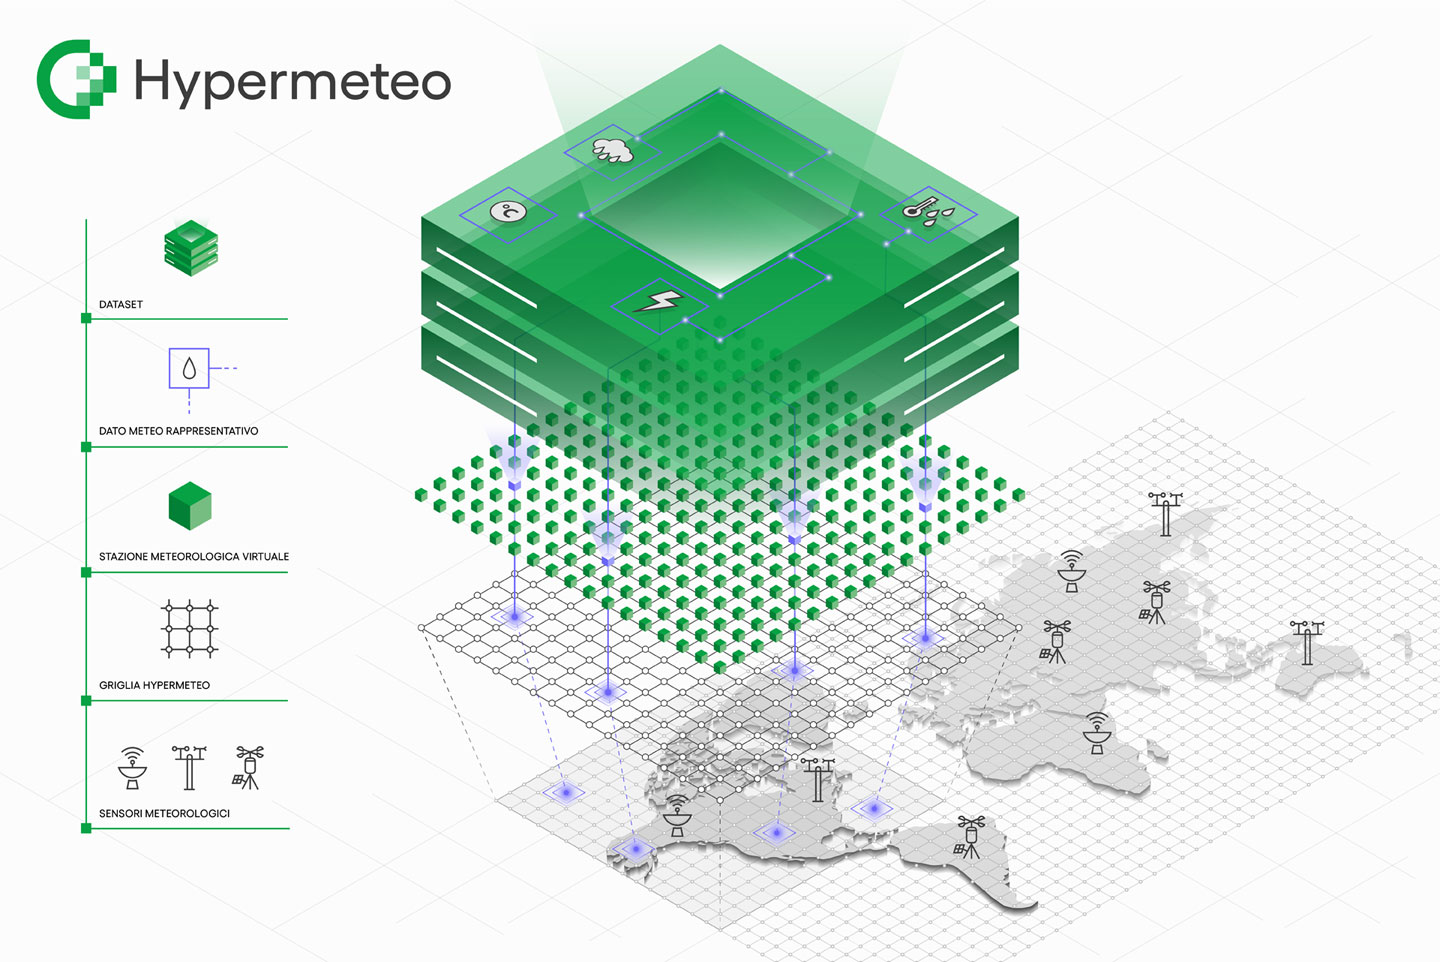
UNIFIED NATIONAL DATABASE
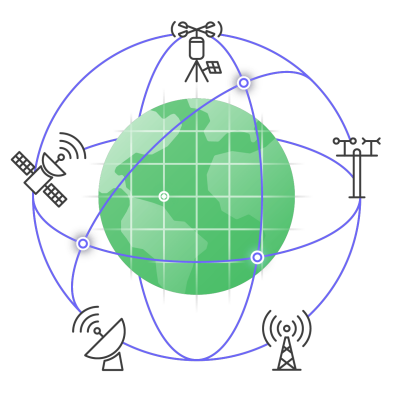
It was therefore first of all necessary refer to a national and coordinated system the meteorological sensors spread throughout the territory and the first unified and coordinated national database was created. The implementation of this system, built and managed with public funds, has allowed the full use and exploitation of a common strategic infrastructure, both for mandatory purposes (e.g. climate change monitoring) and for multiple vocations, thanks to the collective knowledge gathered by public bodies, private companies and citizens.
The creation of the database began with the qualitative selection of stations, sensors and data considered suitable for use. Since almost all the characteristics required of these sensors cannot be directly verified, the analysis has been transferred to the Organisations that are responsible for building, managing and using the networks. They are best placed to assess these networks and provide an adequate guarantee of compliance with standards, verification of formal certifications and alignment to the WMO guidelines.
To date, the system has integrated:
- about 5,000 in situ weather stations from more than 30 networks that collect hourly and daily data,
- about 30 weather radars belonging to the National Department of Civil Protection, Regions and other Authorities,
- the international precision lightning and storm monitoring network.
DATASET PROCESSING TECHNIQUES
The data collected in the unified national database is subjected to a series of processes to verify their quality and spatialisation in order to guarantee their continuity (in space and time), homogeneity and, ultimately, representativeness.

METEOROLOGICAL REANALYSIS AND SPATIALISATION
Meteorological reanalysis, or retrospective analysis, is the scientific methodology that combines the use of numerical models of atmospheric simulation with the data assimilation systems that is normally used in forecasting. This creates homogeneous datasets that describe the past states of the atmosphere on certain portions of territory. The reanalysis subsequently assimilates data from different sources (weather stations, satellites, radar, radio surveys, etc.) and integrates them into a grid using spatialisation algorithms; in this way the state of the atmosphere is reconstructed through its prognostic variables at a certain moment in time and with continuity over the territory.

MULTIMODEL ENSEMBLE FORECASTS
A multimodal ensemble system is used to process forecast data using a range of models that provide different forecast scenarios; these are statistically adjusted to obtain a probabilistic synthesis on the future trend of meteorological variables. The system is based on models implemented in-house by Radarmeteo and integrated with other forecast data processed by both Italian and international major computing centres.
The integration of these data through appropriate analysis algorithms aims to provide the best-case estimate of meteorological variables, taking into account the different model performances. The forecast meteorological data is then further processed with statistical analysis techniques such as MOS (Model Output Statistics) to statistically correct the outputs.

CONTROL, VALIDATION AND DATA INTEGRATION
The data provided by Hypermeteo are constantly subjected to control and validation processes, through both automatic and manual methods (e.g. range test, cross validation, integration with 1km DEM, etc.).
DOMAINS, GRIDS AND VIRTUAL STATIONS
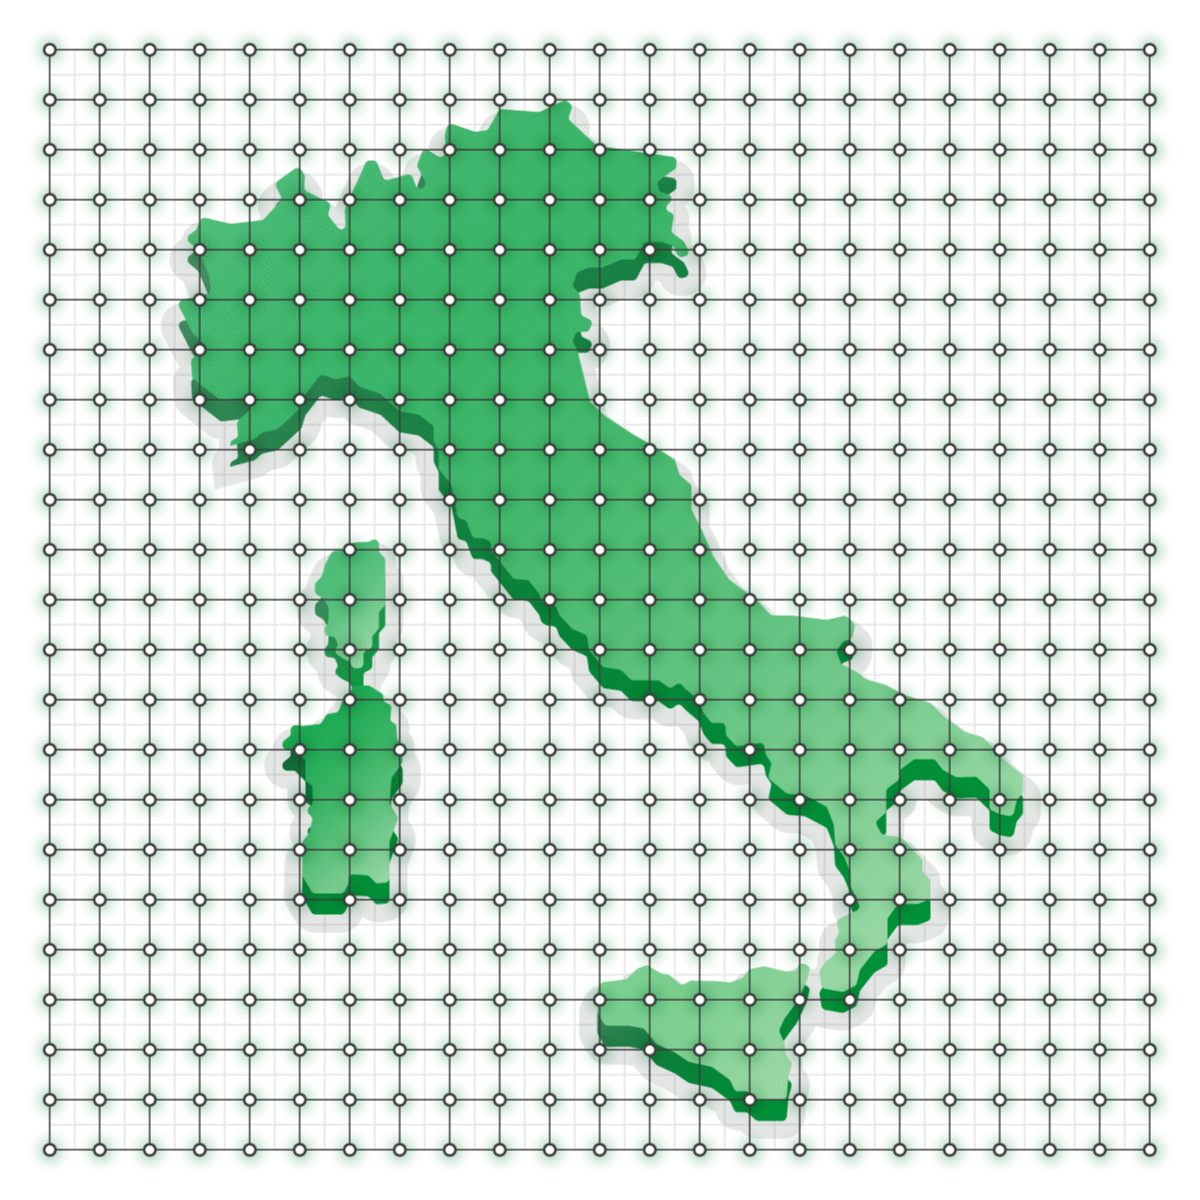
The datasets are then organised on a series of continuous and regular grids to ensure complete coverage of the territory. Each cell of the grid operates as if it were a virtual weather station and is associated to a continuous flow of historical, near real-time and forecast data or a combination thereof. It is therefore possible to associate to each location on the globe a grid point that is representative of its meteorological-climatic conditions.
Generally, the dataset operates on 3 geographical domains (grids) with different resolutions:
- Global domain: grid with a minimum resolution of 0.25° (~31 km) and for defined zones up to 0.01° (~1 km);
- Europe Domain: grid with a minimum resolution of 0.10° (~10 km) and for defined areas up to 0.01° (~1 km);
- Italy domain: native grid with 0.01° resolution (~1 km).
DATA TYPES AND SERVICES
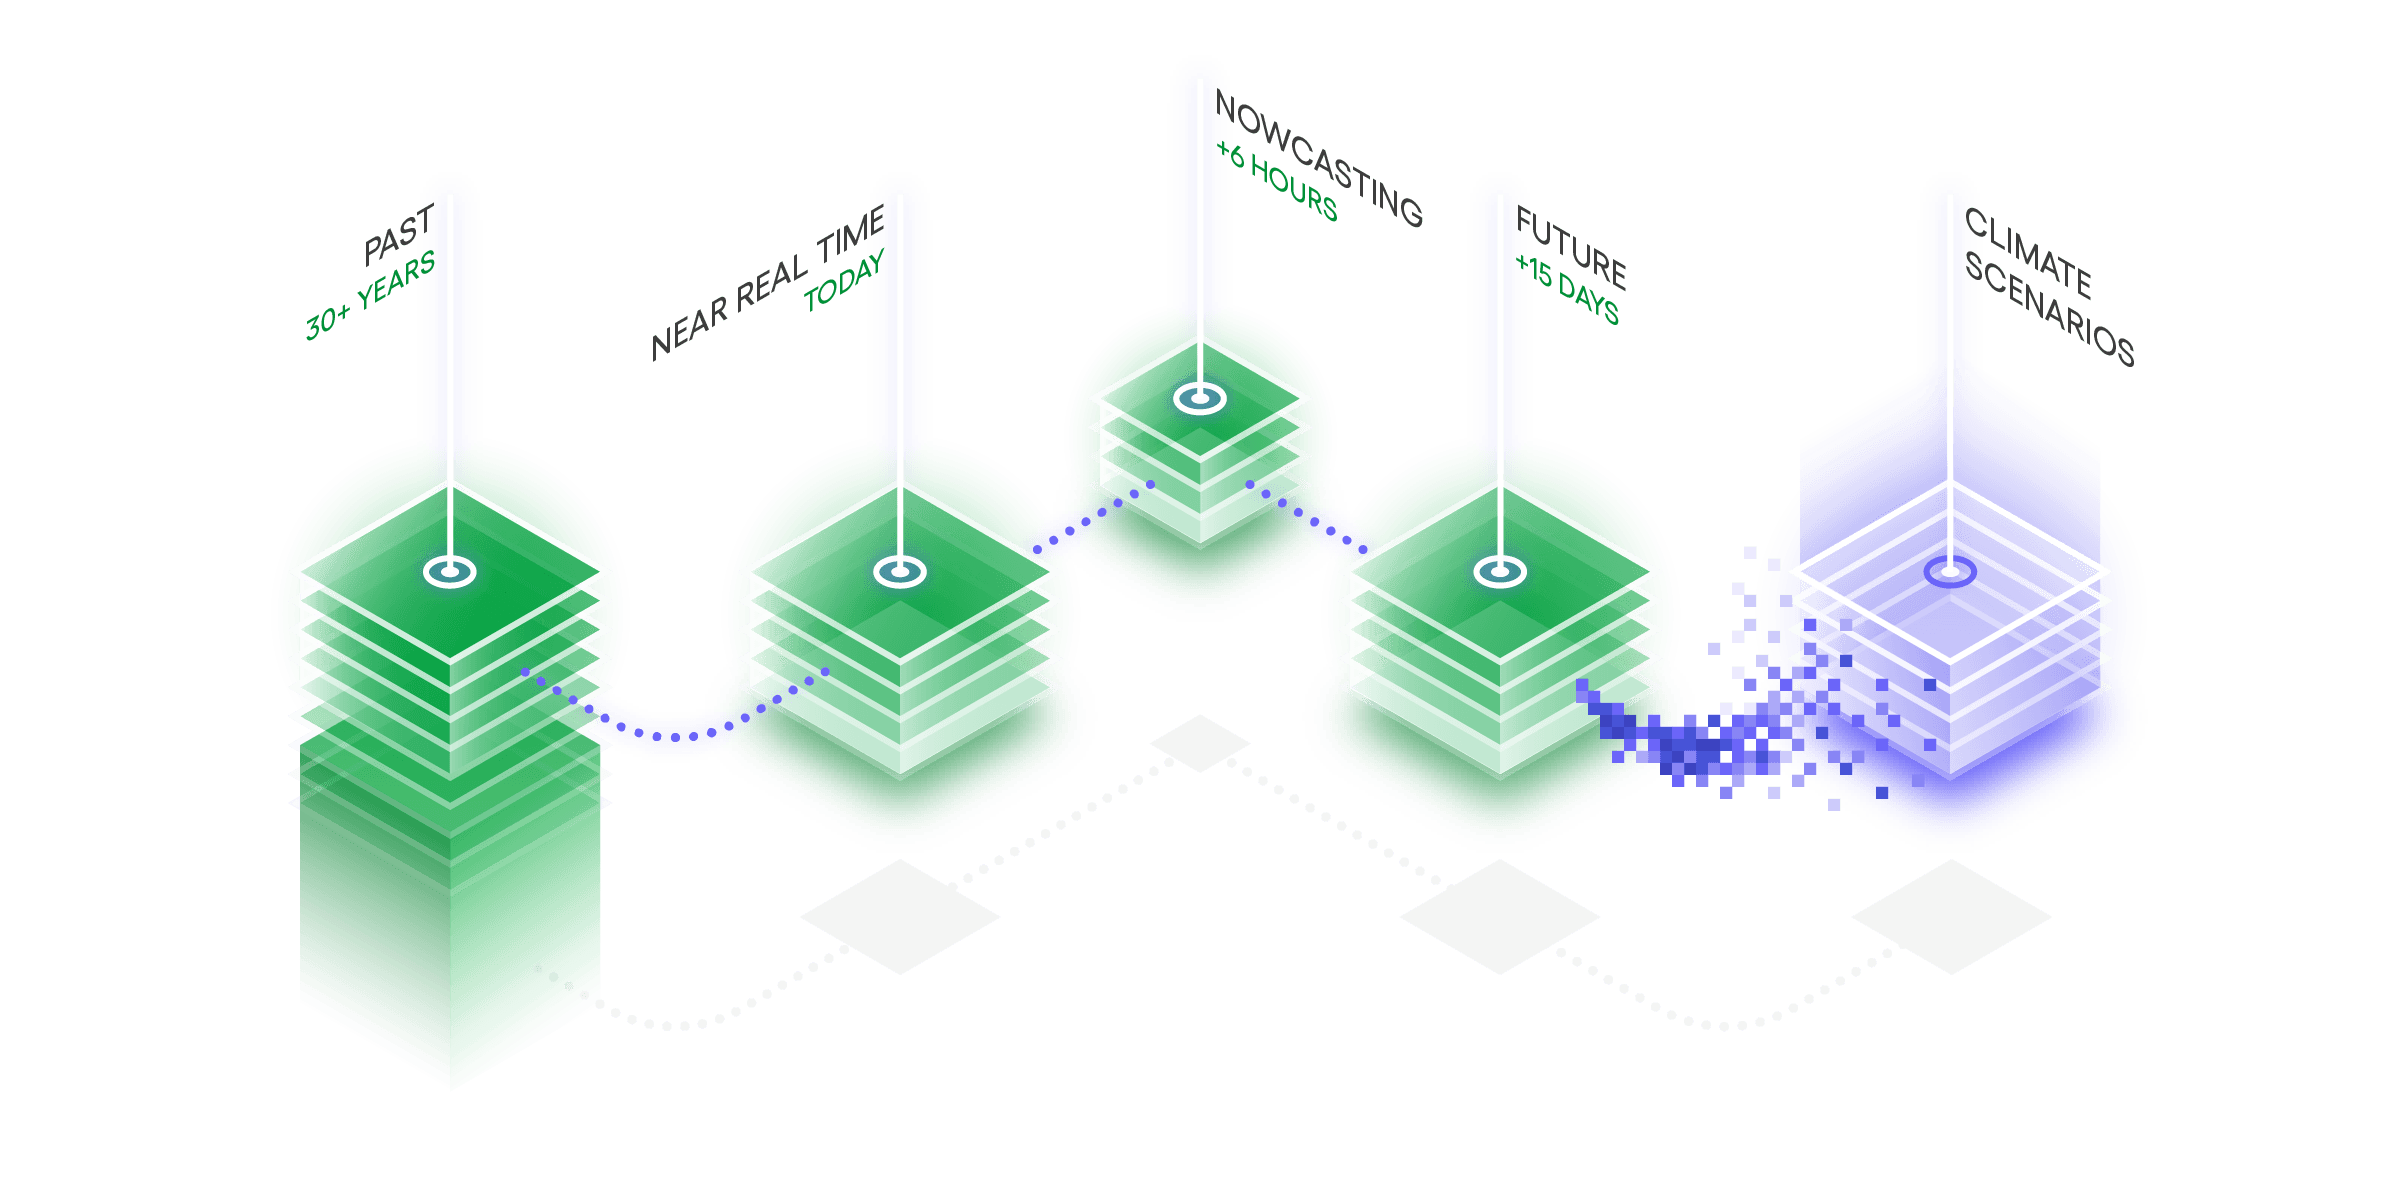

HISTORICAL REANALYSIS DATA
By the expression “historical data”, or “consumed”, we mean the set of past meteorological parameters reconstructed through the method of reanalysis. The historical data that is provided as part of the service cover the last 31 years, from 1990 to 2019 inclusive; however, narrower or wider time windows are available upon request.
From this dataset, a number of specialised calculations can be developed, e.g. the return period for extreme events, the frequency of occurrence of meteorological adverse events in certain periods, or the probability of exceeding a threshold (e.g. for late frosts).

NEAR REAL-TIME DATA
This term refers to the most representative type of data of the current weather situation; it may include daily, hourly or sub-hourly data (e.g. with a 15-minute update rate). Near real-time meteorological data is provided by means of a continuous feed, which allows constant monitoring of the trend of meteorological variables. In this way the historical dataset is continuously updated with the most recent data, and the temporal continuity of the historical series is guaranteed.
They can be used, for example, for daily verification of threshold exceedances (see Ex-Post Alert), to monitor yield trends, vegetation growth and disease development indexes (through integration in agrometeorological DSS), to support hydraulic models for real-time water management, and to monitor the productivity of renewable energy plants (wind, solar, hydroelectric).

FORECAST DATA
Forecast data is that relative to the set of meteorological parameters that are processed by an atmospheric simulation model used in forecasting mode. In other words, instead of being used to carry out a reanalysis of past data, the numerical model is used to simulate future trends for different meteorological parameters starting from a known state of the atmosphere. There are different types of forecasting data: nowcasting (up to 3 hours), short term (up to 72h) and medium-long term data (up to 15 days). For the latter, the multimodal ensemble techniques become very important, because they provide not only raw data but also probabilistic information.
Forecast meteorological data are provided by means of a continuous feed and can be applied in the insurance sector (to support the actuarial assumption phase), in the agricultural sector (to predict the onset of plant diseases and future yield), in the water management sector (to predict the risk of flooding), in the energy sector (to predict the output of wind, solar and hydroelectric plants).
SERVICES

EARLY WARNING
The service allows to structure a real-time alert system with high space-time resolution, therefore dedicated to defined areas (e.g. a municipality) for which quantitative information on the evolution of meteorological parameters (rain, wind, etc.) is provided in the following 72 hours. The forecast data are then considered in relation to the historical measurements and the return period of the relevant phenomena, which provide a means to compare and contextualise of the severity or risk connected with the expected event. The information is updated twice a day and accompanied by maps.
RainCast provides an even more advanced service, where precipitation-related alerts are subject to almost continuous updating through the use of weather radar and nowcasting.
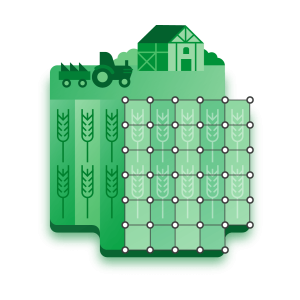
AgroCast®
Meteorology is gaining a leading role in Smart Agriculture (or Agriculture 4.0) sector, where digital technologies are applied to the primary sector, meteorology is gaining a leading role. In agronomic activities, and in particular in precision agriculture, the availability of reliable and consistent meteorological data allows optimisation of choices, actions and therefore results. The application of modular and proportionate responses to specific situations delivers benefits in terms of effectiveness, resource saving and environmental impact. Moreover, the possibility of using integrated innovation systems in agriculture requires the application of digital technology to the meteorological and climatological components of processes. In most cases, the data provided by meteorological services is adequate, but often (e.g. for irrigation, treatments) it may be necessary to use more detailed information, which is obtained by refining the representativeness of existing data or by using dedicated sensors (e.g. to capture solar radiation, ground or soil temperature).
The data provided by Hypermeteo possess these characteristics and are therefore suitable for integration into systems and platforms supporting agricultural and agronomic activities.

PUSH NOTIFICATIONS
Hypermeteo is designed to integrate into third-party applications for the development of push notification services (via API) for adverse weather phenomena based on the position of the user or other devices that can be located (e.g. black box vehicles). Data types (historical, real-time or forecast), weather phenomena (e.g. snowstorm, storm, heavy rain, wind, etc.) and thresholds are customisable to suit the purpose of the application and the end user.

RISK INDICATORS IN THE INSURANCE SECTOR
Risk indicators are a key tool in the insurance sector for several reasons:
- to guide the policy of taking risks from adverse weather conditions,
- calibrate the limits of the guarantee provided (deductible, overdrafts, maximum compensation),
- support analysts in pricing
Hypermeteo’s thirty-year historical dataset covers a sufficiently long, and therefore representative, time window to derive the actual probability distribution of the phenomena. It is configured to provide a solution that allows to measure the frequency of a given past event and, therefore, to estimate the probability of its occurrence in the future; given its spatial and temporal homogeneity and the available data grids, it is possible to carry out an extensive analysis on the geographical area of interest, whether regional, national or global.
Moreover, based on the expertise of our data scientists, Radarmeteo is able to support customer organisations in the determination of territorial risk indicators for the main atmospheric adverse events. Interaction with the customer during the analysis process will allow to define conventional evaluation criteria for probability and severity of damage in order to achieve the necessary calibration of the indicator.
SIGN UP TO OUR NEWSLETTER
Sign up to stay updated on our activities! You will find us in your inbox about once a month.