RainGis®
The service that renders geo-referenced accumulated precipitation data for the entire national territory on an interactive map, integrating radar measurements with those coming from meteorological stations on the ground.
STRENGTHS
Accuracy
Export
Immediate
Integration
VISUALISATION ON INTERACTIVE GIS SYSTEM
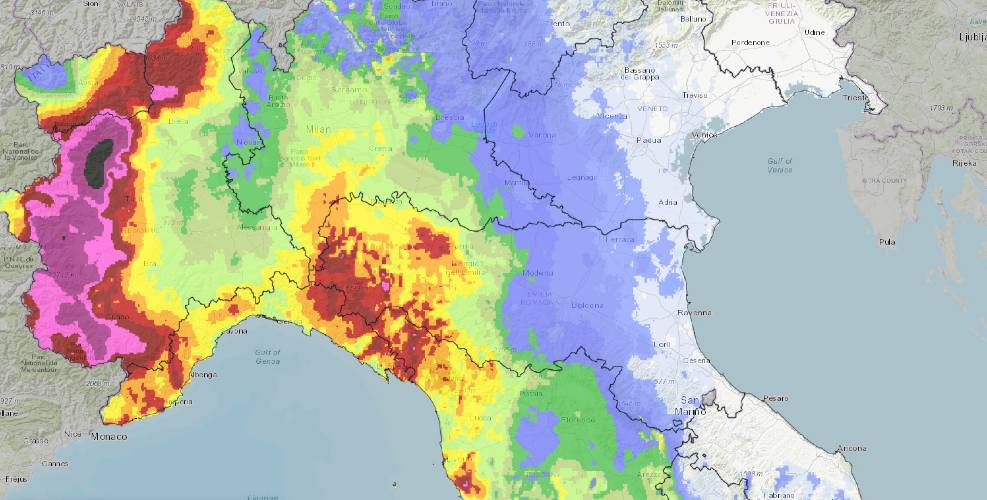
RADAR AND STATION DATA INTEGRATION
The accumulated precipitation is calculated by integrating (merging) the radar data with the data of the in situ stations in order to obtain high accuracy data.
INTERACTIVE CARTOGRAPHIC SYSTEM
The data are displayed on an interactive cartographic system allowing the clear identification of the areas affected by precipitation and the relative accumulations for each km2 of the territory
CUSTOMISATION
The visualisation of precipitation data is customised on the customer’s area with the possibility of displaying additional cartographic layers of interest (e.g. consortium boundaries, structures, etc.).
REAL-TIME AND ARCHIVE DATA
REAL-TIME DATA
The data is available in real time, with hourly update, relating to the accumulations of the last 1, 3, 6, 12, 24, 48, 72 hours.
ARCHIVE DATA
With a simple menu it is possible to consult the archive data of all rain events starting from January 2018.
WEATHER STATION DATA
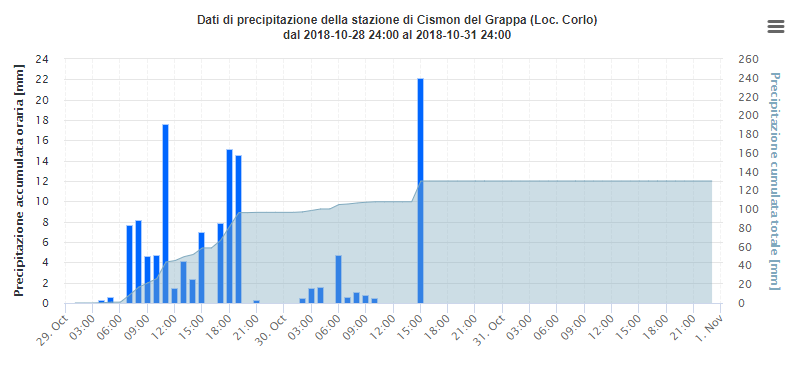
In addition to the integrated accumulated precipitation data, it is possible to view individual station data (in table or graphical form) that has been used for processing.
DATA EXPORT AND INTEGRATION
EXPORT OF GRAPHS
The displayed data can be exported in image format in the form of graphs showing the hourly trend and total accumulated precipitation.
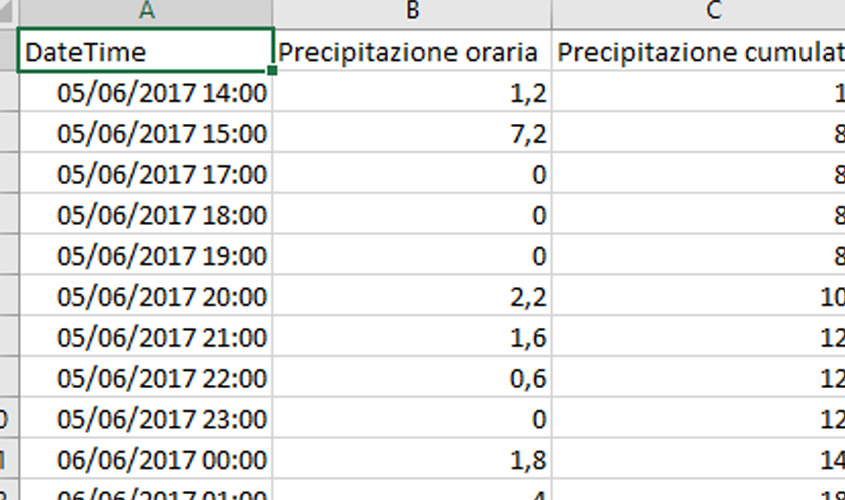
EXPORT OF TABLES
In addition to exporting in graphic format, it is possible to export the data in numerical table format, to allow a more in-depth analysis.
DATA INTEGRATION
The accumulated precipitation data can be prepared in numerical form to be integrated into the client’s applications/platforms/systems.
SIGN UP TO OUR NEWSLETTER
Sign up to stay updated on our activities! You will find us in your inbox about once a month.